Calderdale wards
Calderdale wards
Calderdale is a metropolitan district, situated in the South Pennines between Greater Manchester, and Leeds and Bradford. Within England, it is one of the larger districts by area, but one of the smallest by population, covering the towns of Brighouse, Elland, Halifax, Hebden Bridge, Sowerby Bridge and Todmorden. The headline demographic statistics are:
- the district covers 140 square miles, or 36,392 hectares,
- the population of Calderdale is 206,600 (Office for National Statistics (ONS): Census 2021, Population and household estimates),
- the average number of people per hectare is 5.7 people.
The latest population figures come from Census 2021. To see what Census 2021 data has been published, see:
- Nationally: Census 2021 publications.
- Calderdale: Census 2021 dataset.
For the latest population figures at ward level in Calderdale see Population estimate dataset.
More information on Calderdale population statistics, see our blog on Population statistics in Calderdale.
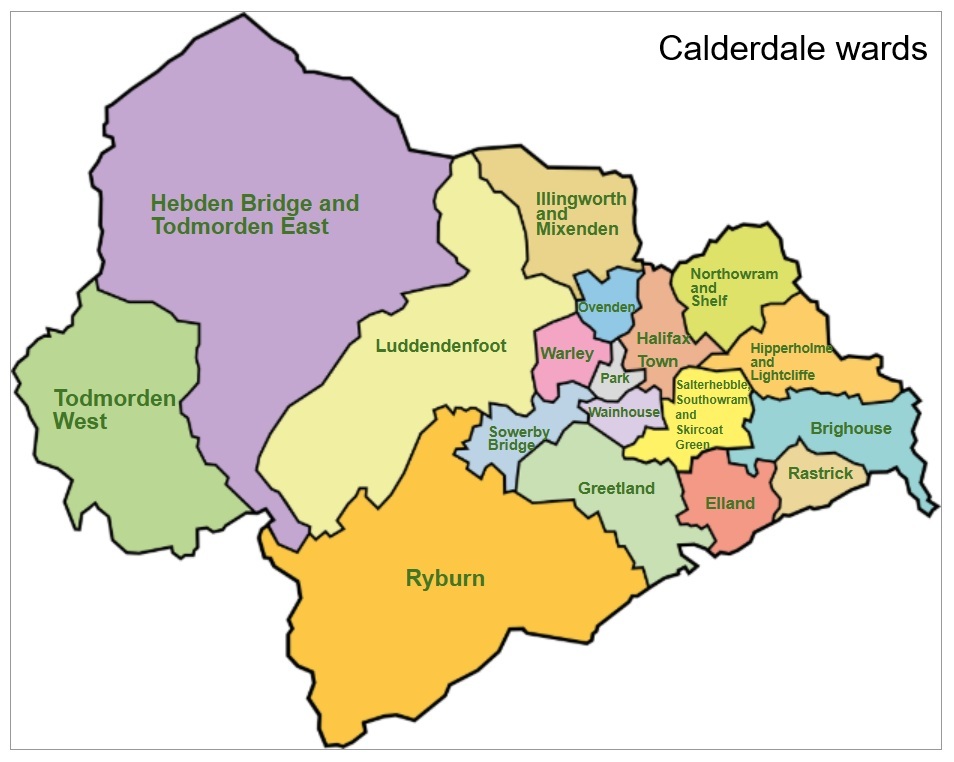
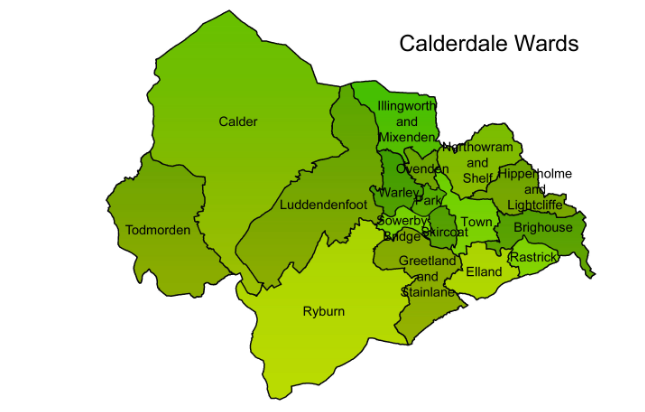
Up to the local (ward) elections held on 7 May 2026, Calderdale had 17 wards. The Calderdale (Electoral changes) Order 2024 as recommended by the Local Government Boundary Commission review (Calderdale | LGBCE) has changed this to 18 wards. These came into effect at the 7 May 2026 elections.
Ward profiles from 7 May 2026
We have created a ward demographic profile for each of the 18 new wards using LG Inform Plus. You can find these at Calderdale ward demographic profiles.
Ward profiles prior to 7 May 2026
In June or July the Office for National Statistics (ONS) will publish the ward boundary information for the 2026 wards. We will then update the following data using the new wards.
Calderdale has 17 wards with different geographic sizes and demographics – some wards are mainly urban, whereas others include large rural areas. Over three quarters of Calderdale residents live in urban areas. Four fifths of the Calderdale area are rural.
The range of open data available at ward level is wide, and we have used several ways to display this data, including maps, raw data, data visualisations, reports and more:
Ward datasets / School datasets / Data visualisations
Ward datasets
The Ward datasets act as signposts to individual datasets that have data at ward level, with links to data such as population estimates, public health, and data visualisations on specific topics. As more datasets at ward level are added to Data Works, these links will be added too. As well as links to other datasets, the Ward datasets include reports on the demographic and Index of Multiple Deprivation (IMD) data relating to each ward, maps and a brief description of the ward topography:
Calderdale MSOA demographic profiles
Calderdale district has 27 medium layer super output areas (MSOAs). MSOAs are geospatial statistical terms developed by the Office for National Statistics (ONS) for the reporting of statistics of similar population sizes.
The ONS has assigned each MSOA with a code (eg E0200224) and a label (eg Calderdale 001).
The House of Commons Library MSOA names project has given each MSOA a recognisable name that reflects any towns, villages and neighbourhoods in the area represented.
Calderdale Dataworks includes a series of demographic profiles on each MSOA in Calderdale.
Census geographies
The Office for National Statistics has developed a number of small area geospatial statistical terms for reporting statistics of similar population sizes. These include Medium layer super output areas (MSOAs) and Lower layer super output areas (LSOAs). MSOAs and LSOAs do not fit exactly into ward boundaries, The Office for National Statistics (ONS) have defined a best fit for each MSOA and LSOA. For further details, plus the ONS reference E code for wards, MSOAs and LSOAs, see: Calderdale areas by postcode. These are used in census and other statistical data.
School datasets
Some of the data relating to Calderdale schools is available at ward level. This includes data from the School census, and from data collections on attainment at different stages.
You can access these datasets via Schools data at ward level.
Data visualisations
Sometimes it is easier to provide headline data as a visualisation, rather than just black and white numbers. We have several dashboards showing data at ward and or LSOA (Lower level Super Output Area):
- Poverty in Calderdale: selected statistics: This uses many data sets to show different aspects of poverty in Calderdale. Some are at both ward and LSOA level. This dashboard has been created by Performance and Business Intelligence together with the Anti Poverty Partnership in Calderdale.
- English Indices of Deprivation (IoD): Calderdale dashboards: IoD is the official measure of deprivation at neighbourhood level and is updated every three or four years. These dashboards show results for Calderdale for the overall Index of Multiple Deprivation in 2019, change since 2015 plus the individual and supplementary indices that make up these data sets.
- Ward elections: This dashboard gives a breakdown of the results from ward elections since 2014.