Footfall Data
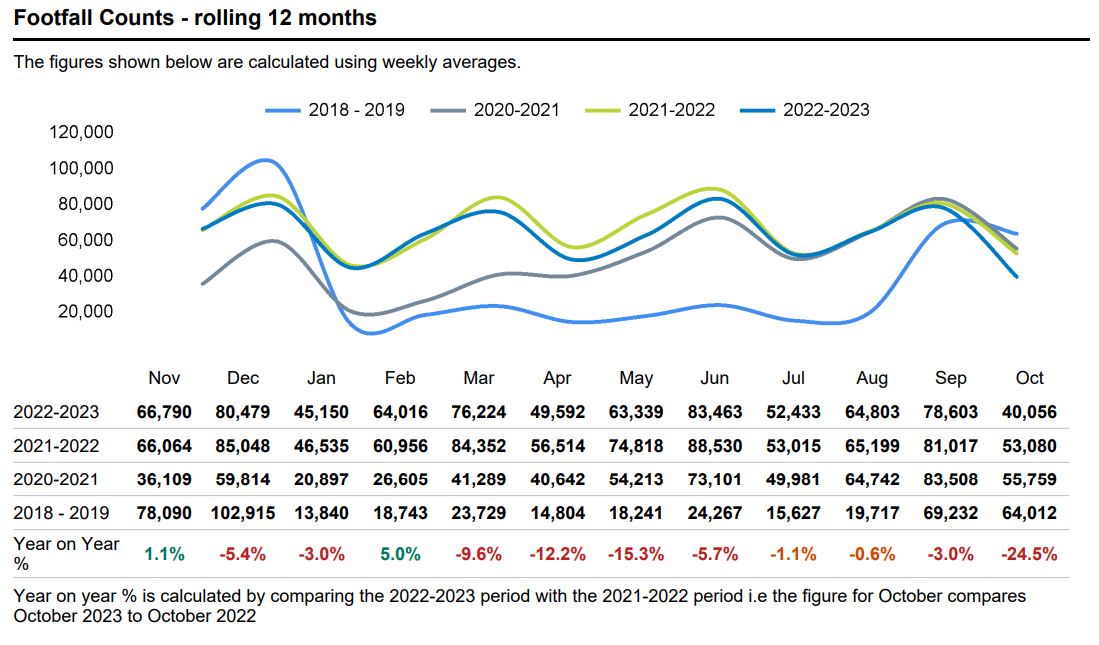
We’ve recently published footfall reports showing data from Halifax BID (Business Improvement District) based on footfall recorded in Commercial Street and Corn Market in Halifax town centre. Data is shown by hour, day, week and rolling 12-months along with a comparison to previous years and is provided by Springboard. We hope to publish more footfall data from other town BIDs in future and there is potential to develop our dashboards with this data.
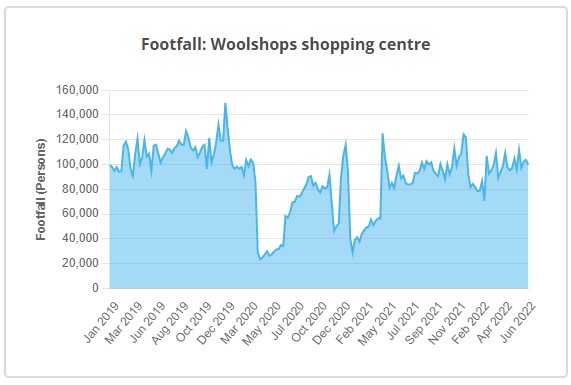
This adds to the existing Halifax footfall data already provided for Woolshops Shopping Centre which shows weekly footfall and car park usage data since 2019, including the impact and subsequent recovery from the COVID-19 pandemic.
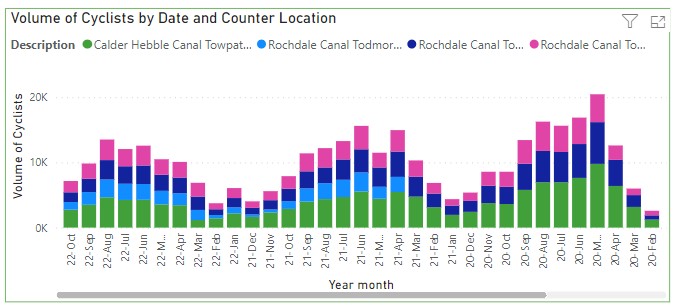
We also have a cycle count dataset which shows cycle counts from 4 recorders located in Calderdale and our Cycle Lane Counter Dashboard provides a visualisation of this raw data showing the volume of cyclists by month/year and counter location. We have a similar dataset for Traffic count from 8 counters located around Calderdale and a Traffic count dashboard which provides a visualisation of this raw data split by full year count and snapshot count of vehicles at each counter location.
Also see West Yorkshire Combined Authority (WYCA) Economic and Transport Insights monthly reports which cover macro-economic trends, travel behaviour patters and footfall data in the region.
Let us know if you have other footfall related data for Calderdale that could be published. We’d also like to know how you’re using this data and if you’re finding it helpful.