Poverty and Data
Our Anti-Poverty dashboard shows a collection of selected statistics on poverty in Calderdale which has been developed alongside the Calderdale Anti-Poverty action plan. You can find more detail about this dashboard below.
You can also find out more about poverty in the region and get involved with our friends at Open Innovations who are working on a project with the Joseph Rowntree Foundation (JRF) to help understand poverty in the North.
They are going to build an Insight Finder; an online, interactive data hub. It will draw on local data sources, and provide targeted insight into small regions and local authorities in the North of England, with a particular focus on areas where poverty is prevalent.
Calderdale Anti-Poverty Dashboard
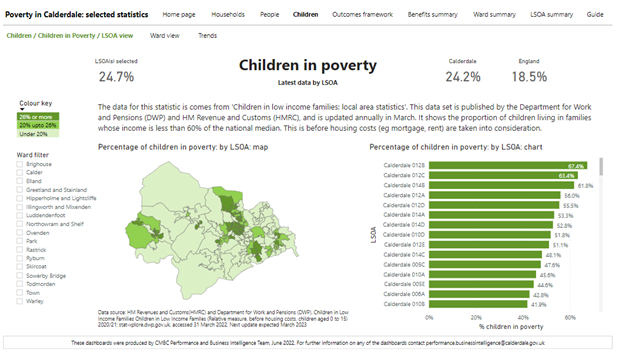
Each statistic on the home page links to other related dashboards, such as ‘Children in Poverty’. This example has three dashboards as illustrated below which show results by ward, or lower layer super output area (LSOA), and trends compared to other areas.
The Anti-Poverty dashboard brings together a range of different data sets from different source, to help capture evidence of poverty within Calderdale.