Indices of Deprivation Dashboard and Anti-Poverty Dashboard
Our latest two refreshed dashboards to go live on DataWorks are Indices of Deprivation and Anti-Poverty, these have both been developed in Power BI.
The IoD dashboard is based on a set of datasets including the Index of Multiple Deprivation (IMD) published by Government and was last published in September 2019.
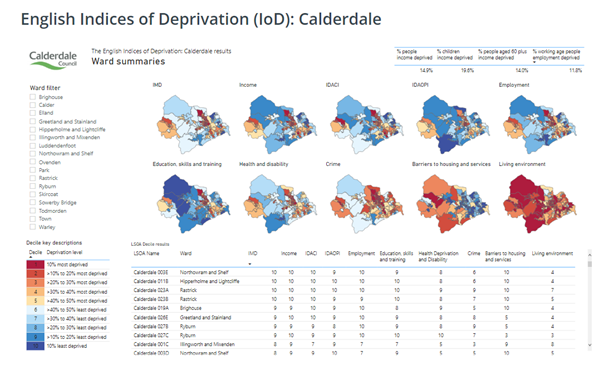
There are five IoD Dashboards showing a range of different maps showing either 2019 data or the change between 2019 and the previous release (2015) including:
- IMD and individual domains (income, employment, education, crime, health, access to services, living environment);
- supplementary indices of Income Deprivation affecting Children Index (IDACI) and Income Deprivation affecting Older People (IDAOPI);
- sub domains of education (adults and children), access to services (geographical, wider), and living environment (indoor and outdoor).
Each map can be customised by the user to show results for one or more ward, LSOA, or deprivation level.
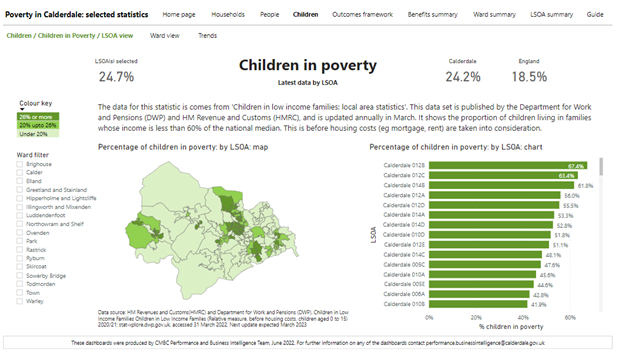
“Poverty in Calderdale: selected statistics” – also known as the Calderdale Anti-Poverty dashboards – shows a collection of selected statistics on poverty in Calderdale which has been developed alongside the Calderdale Anti-Poverty action plan.

Each statistic on the home page links to other related dashboards, such as ‘Children in Poverty’. This example has three dashboards as illustrated below which show results by ward, or lower layer super output area (LSOA), and trends compared to other areas.


The Anti-Poverty dashboard brings together a range of different data sets from different source, to help capture evidence of poverty within Calderdale.
We have also built the below dashboards in Power BI: